
Analytics
The Analytics page, in the side menu, sums up how your riders ride, how loyal they are to your workshop and whether their services happen on time. Each rider and each bike also has its own figures on their cards and pages.
We work them out from the rides we import from their sports apps and the services you record. When there is not enough data for a figure yet, we do not show it as a zero: the key figures say Not enough data, and the charts explain it with their own message.
Filters
The filters at the top apply to the whole page:
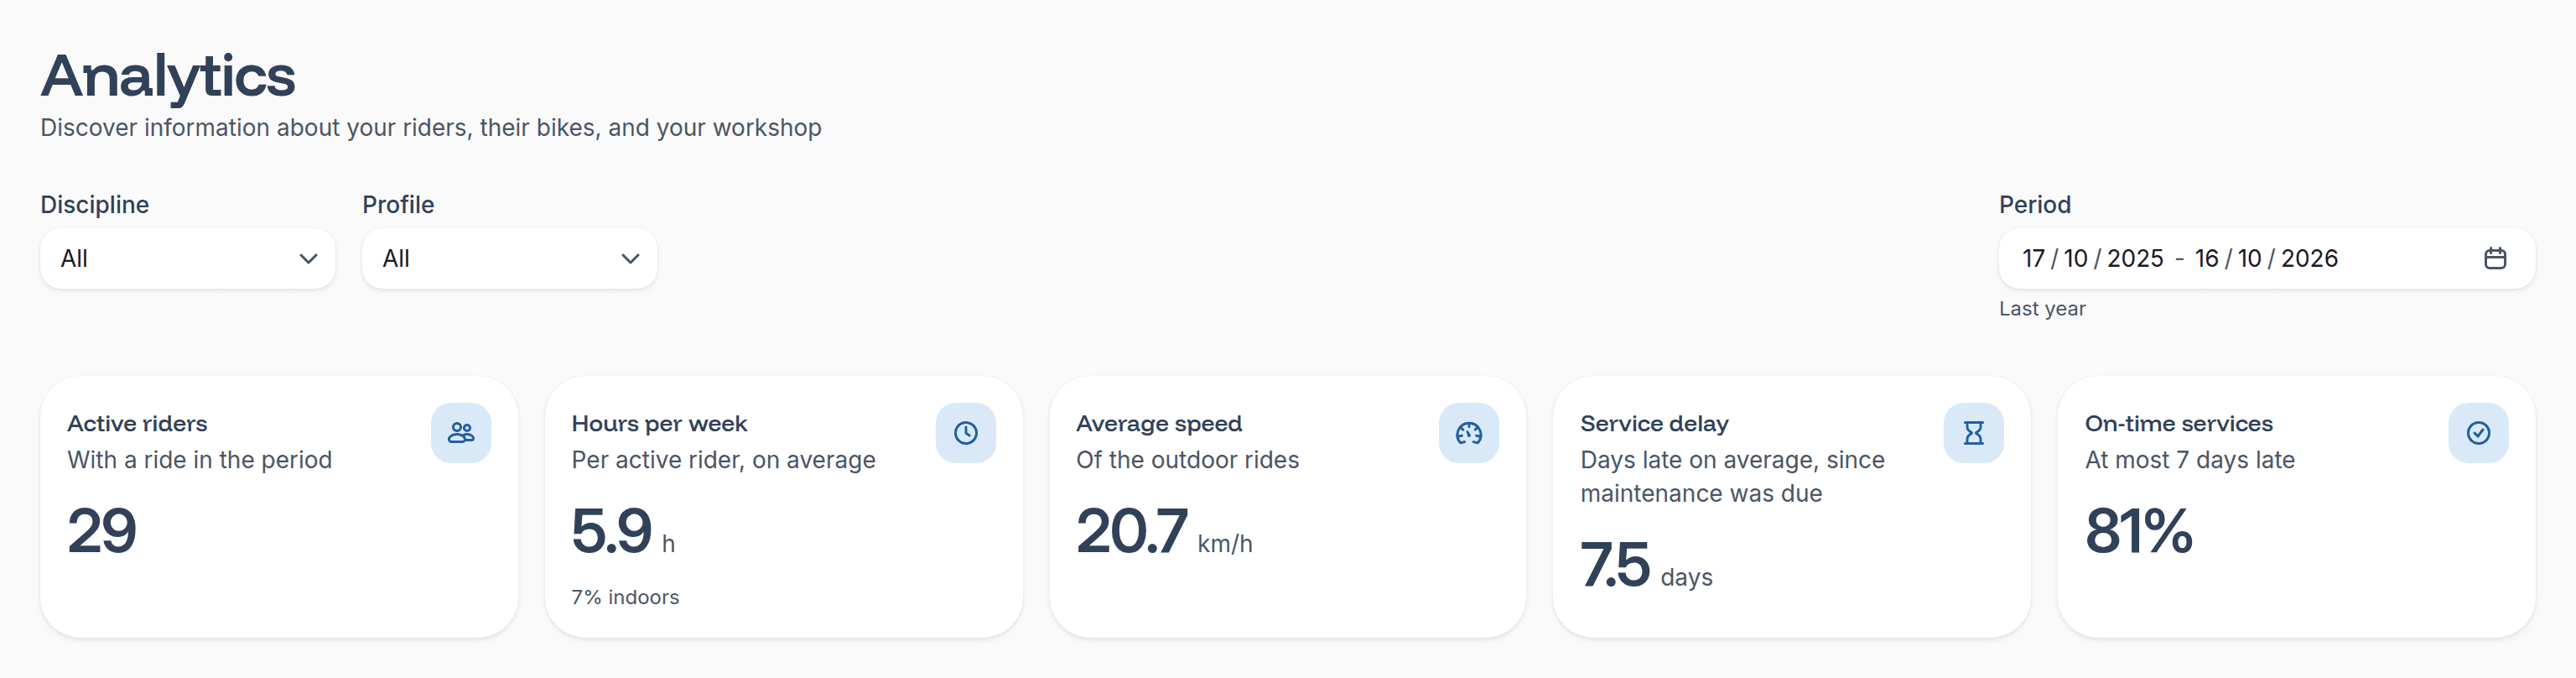
Period:Last year(the default),Year to date,Last 3 months,Last monthor the dates you pick in the calendar.Discipline:All, or a single one, such asRoad,Mountain,GravelorIndoor. It shows only the riders with at least one ride in that discipline during the period, and hours and speed count only those rides.Profile:All, or only the riders with one of the profiles.
Key figures
Active riders: the riders with rides in the period.Hours per week: the average per active rider, with the share they rode indoors.Average speed: the average speed of outdoor rides. Indoor rides do not count.Service delay: how many days go by, on average, from the estimated day of a service to the day you do it.On-time services: the share of services done at most 7 days late.
The estimated day is when the bike has ridden your maintenance interval since its previous service.
Maintenance
Four cards about services and visits:
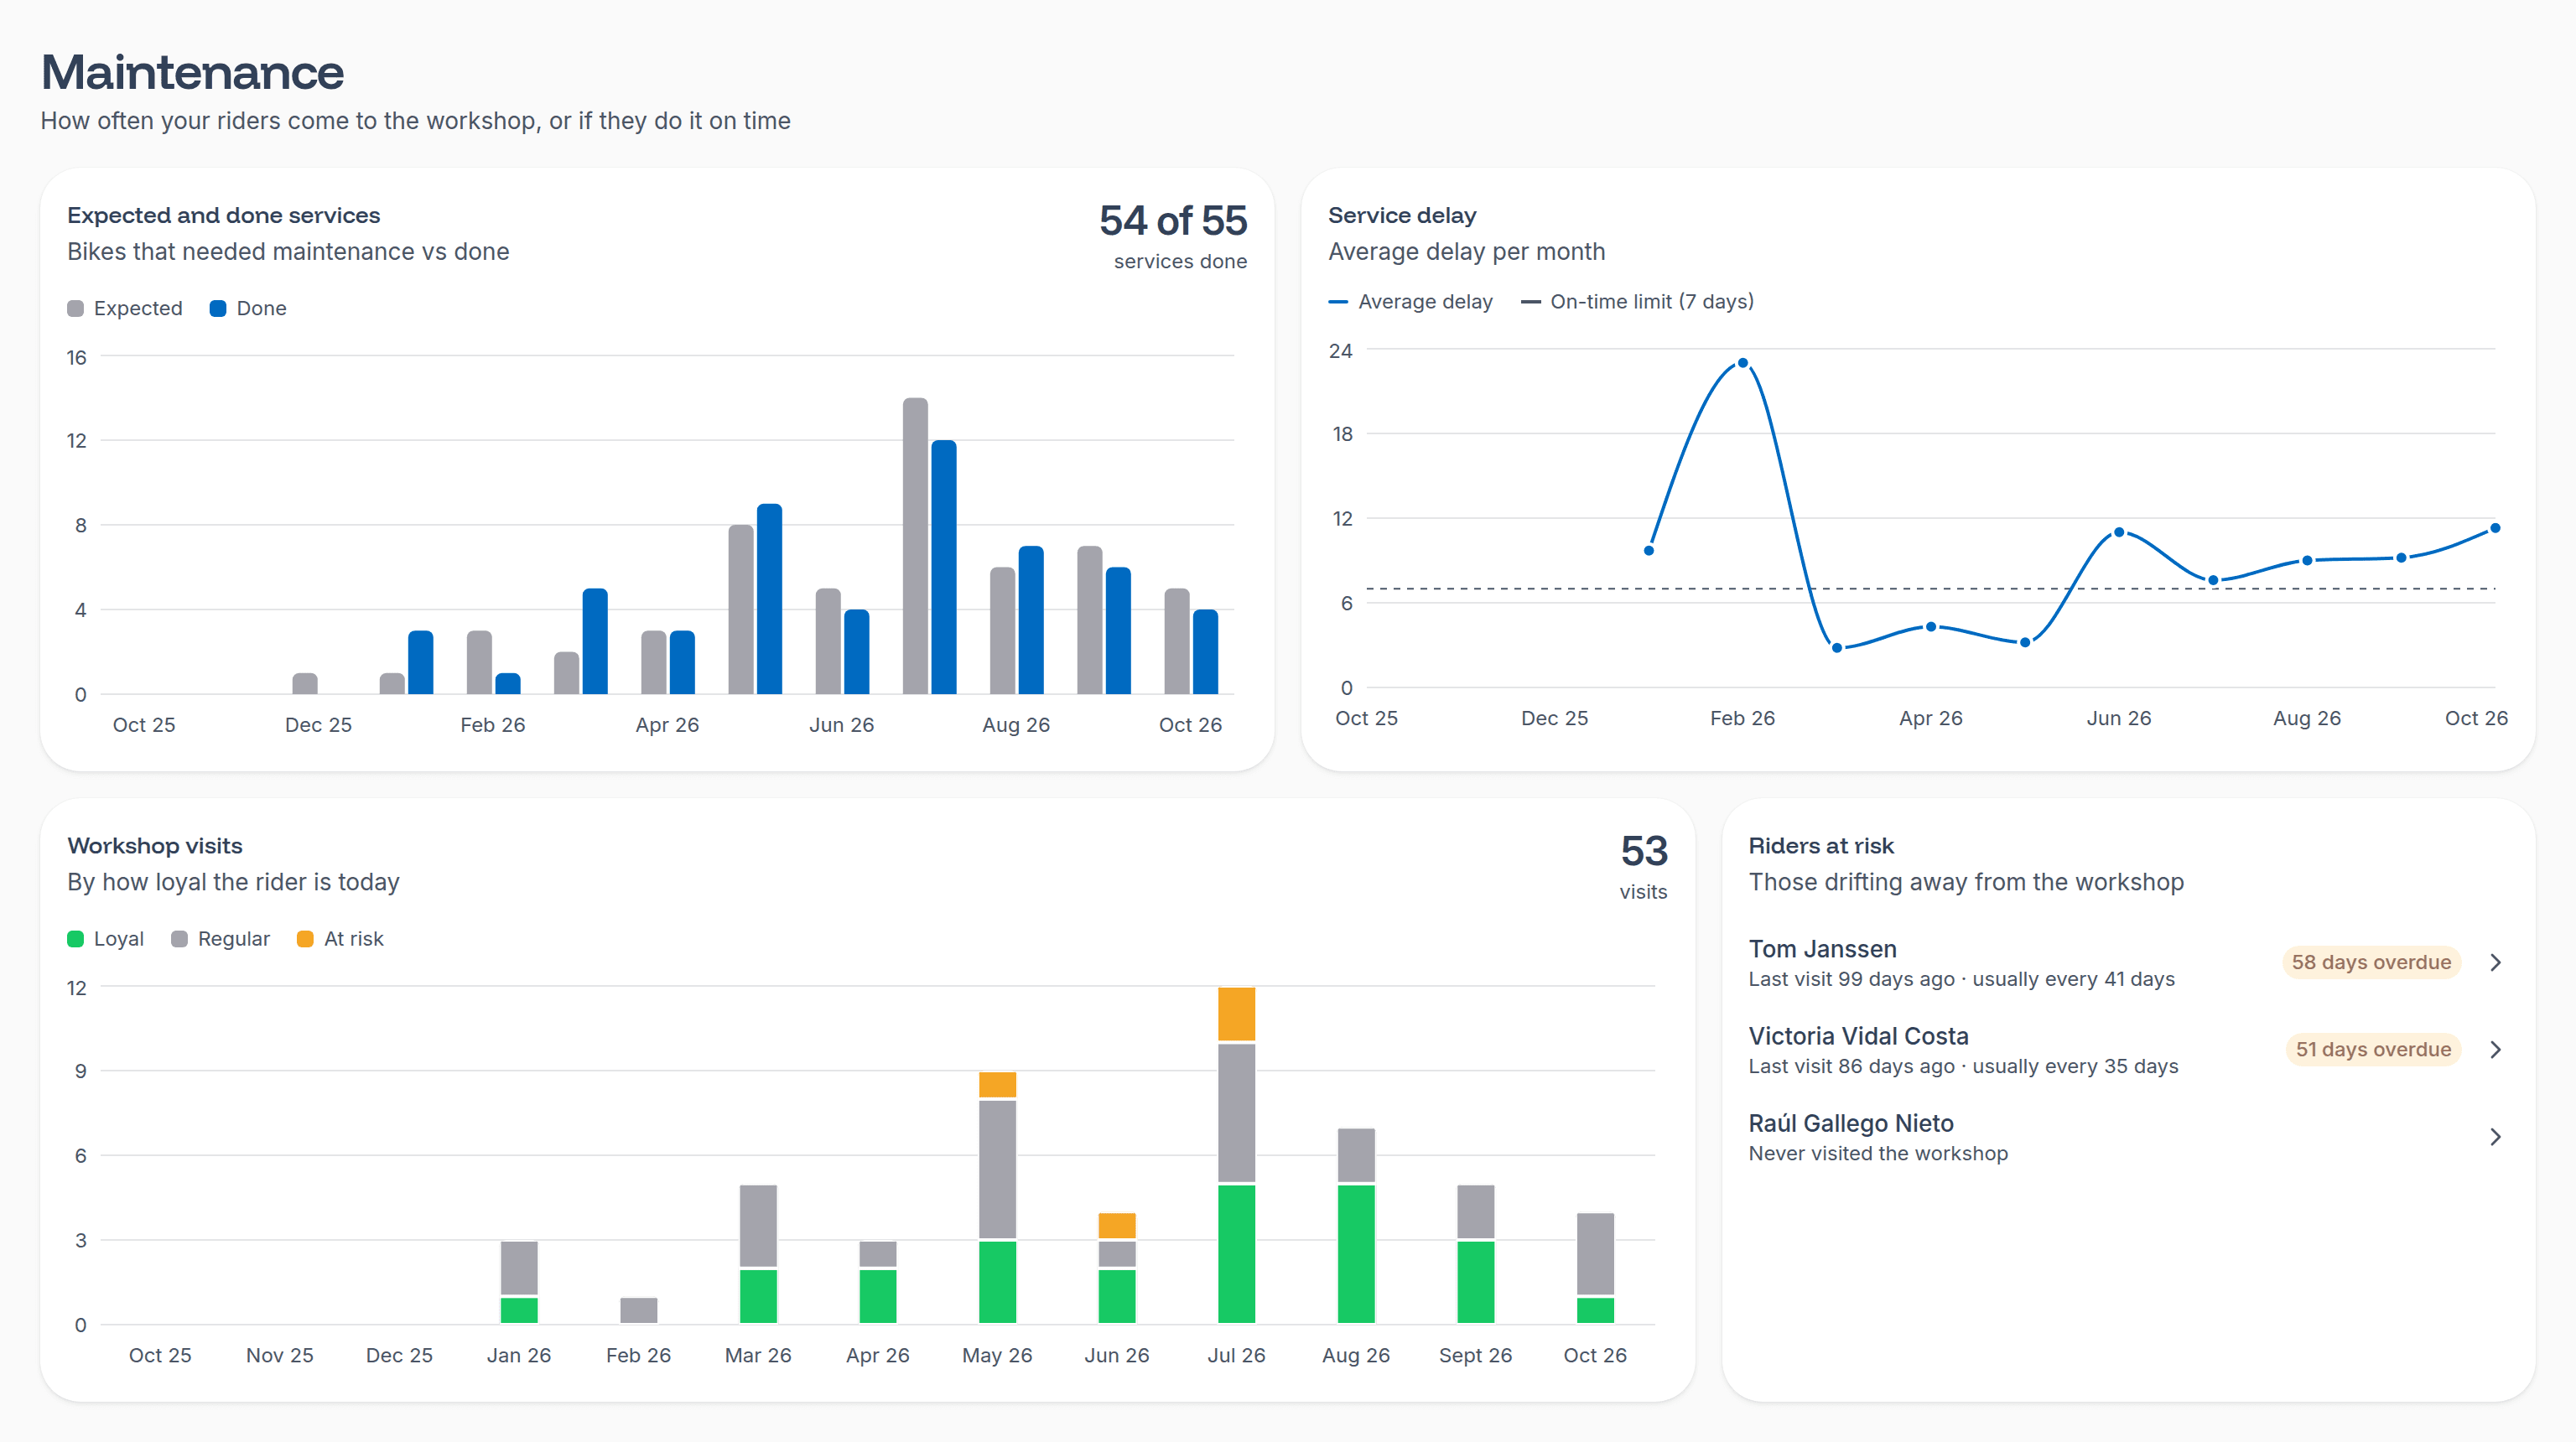
Expected and done services: the bikes that reached your maintenance interval each month, against the services you did.Service delay: each month's average delay, next to the 7-day limit for being on time.Workshop visits: the days your riders came by the workshop each month, by how loyal each one is at the end of the period. A visit is a day your workshop serviced any of their bikes.Riders at risk: those drifting away from the workshop, the most overdue first. For each one you see when they last came in (orNever visited the workshop), how often they usually come if they have come twice or more, and how many days overdue they are. Click one to open their page.
Your riders
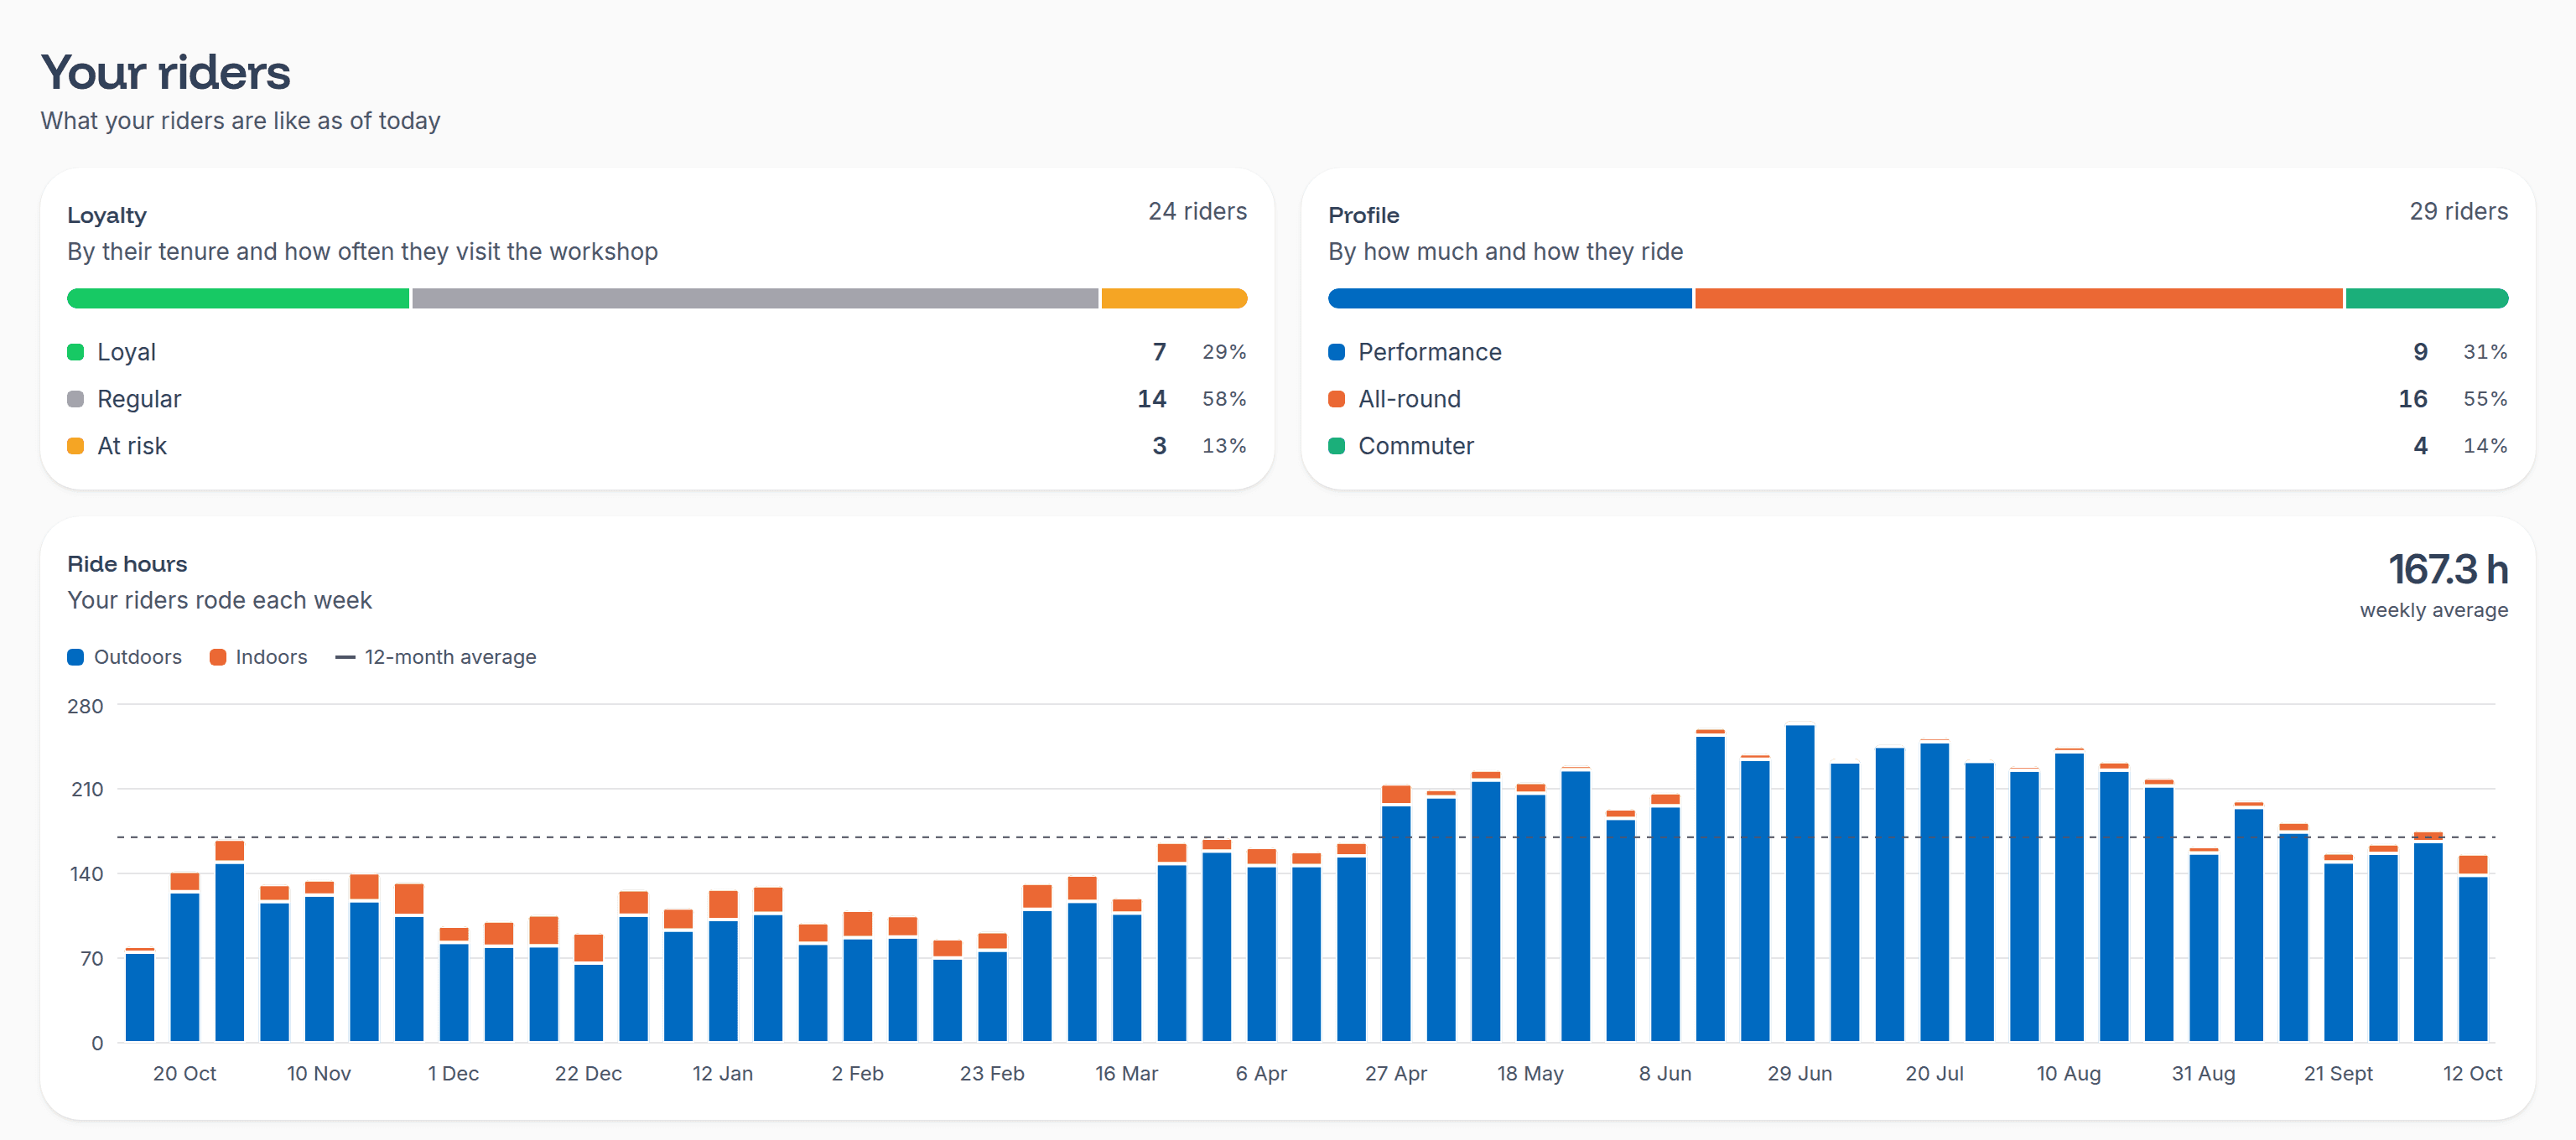
What your riders are like at the end of the period, and how many hours they ride.
Loyalty
By how long they have been with your workshop and how often they visit it:
Loyal: a client for at least 12 months, with at least 2 visits.Regular: visits the workshop as often as usual.At risk: no visits in over twice their usual time, or in 12 months.
A rider has no segment until they accept your invitation. They also have none while they have never visited the workshop and joined less than 12 months ago.
Profile
By how much and how they ride, from their rides over the last 12 months:
Commuter: half of their outdoor rides or more are commutes.Performance: rides 8 h per week or more, or fast on average: over 29 km/h on road rides, 22 km/h on gravel or 16 km/h on mountain bike rides.All-round: rides a bit of everything.
It takes 4 weeks of rides to tell a rider's profile.
Ride hours
The hours your riders rode each week, Outdoors and Indoors, next to the 12-month average.
On rider and bike pages
Outside the Analytics page, each rider and each bike has its own figures:
- Rider cards in the riders list: each rider's loyalty and profile, and their hours per week over the last 4 weeks. An arrow shows whether they rise or fall by 10% or more against their yearly average.
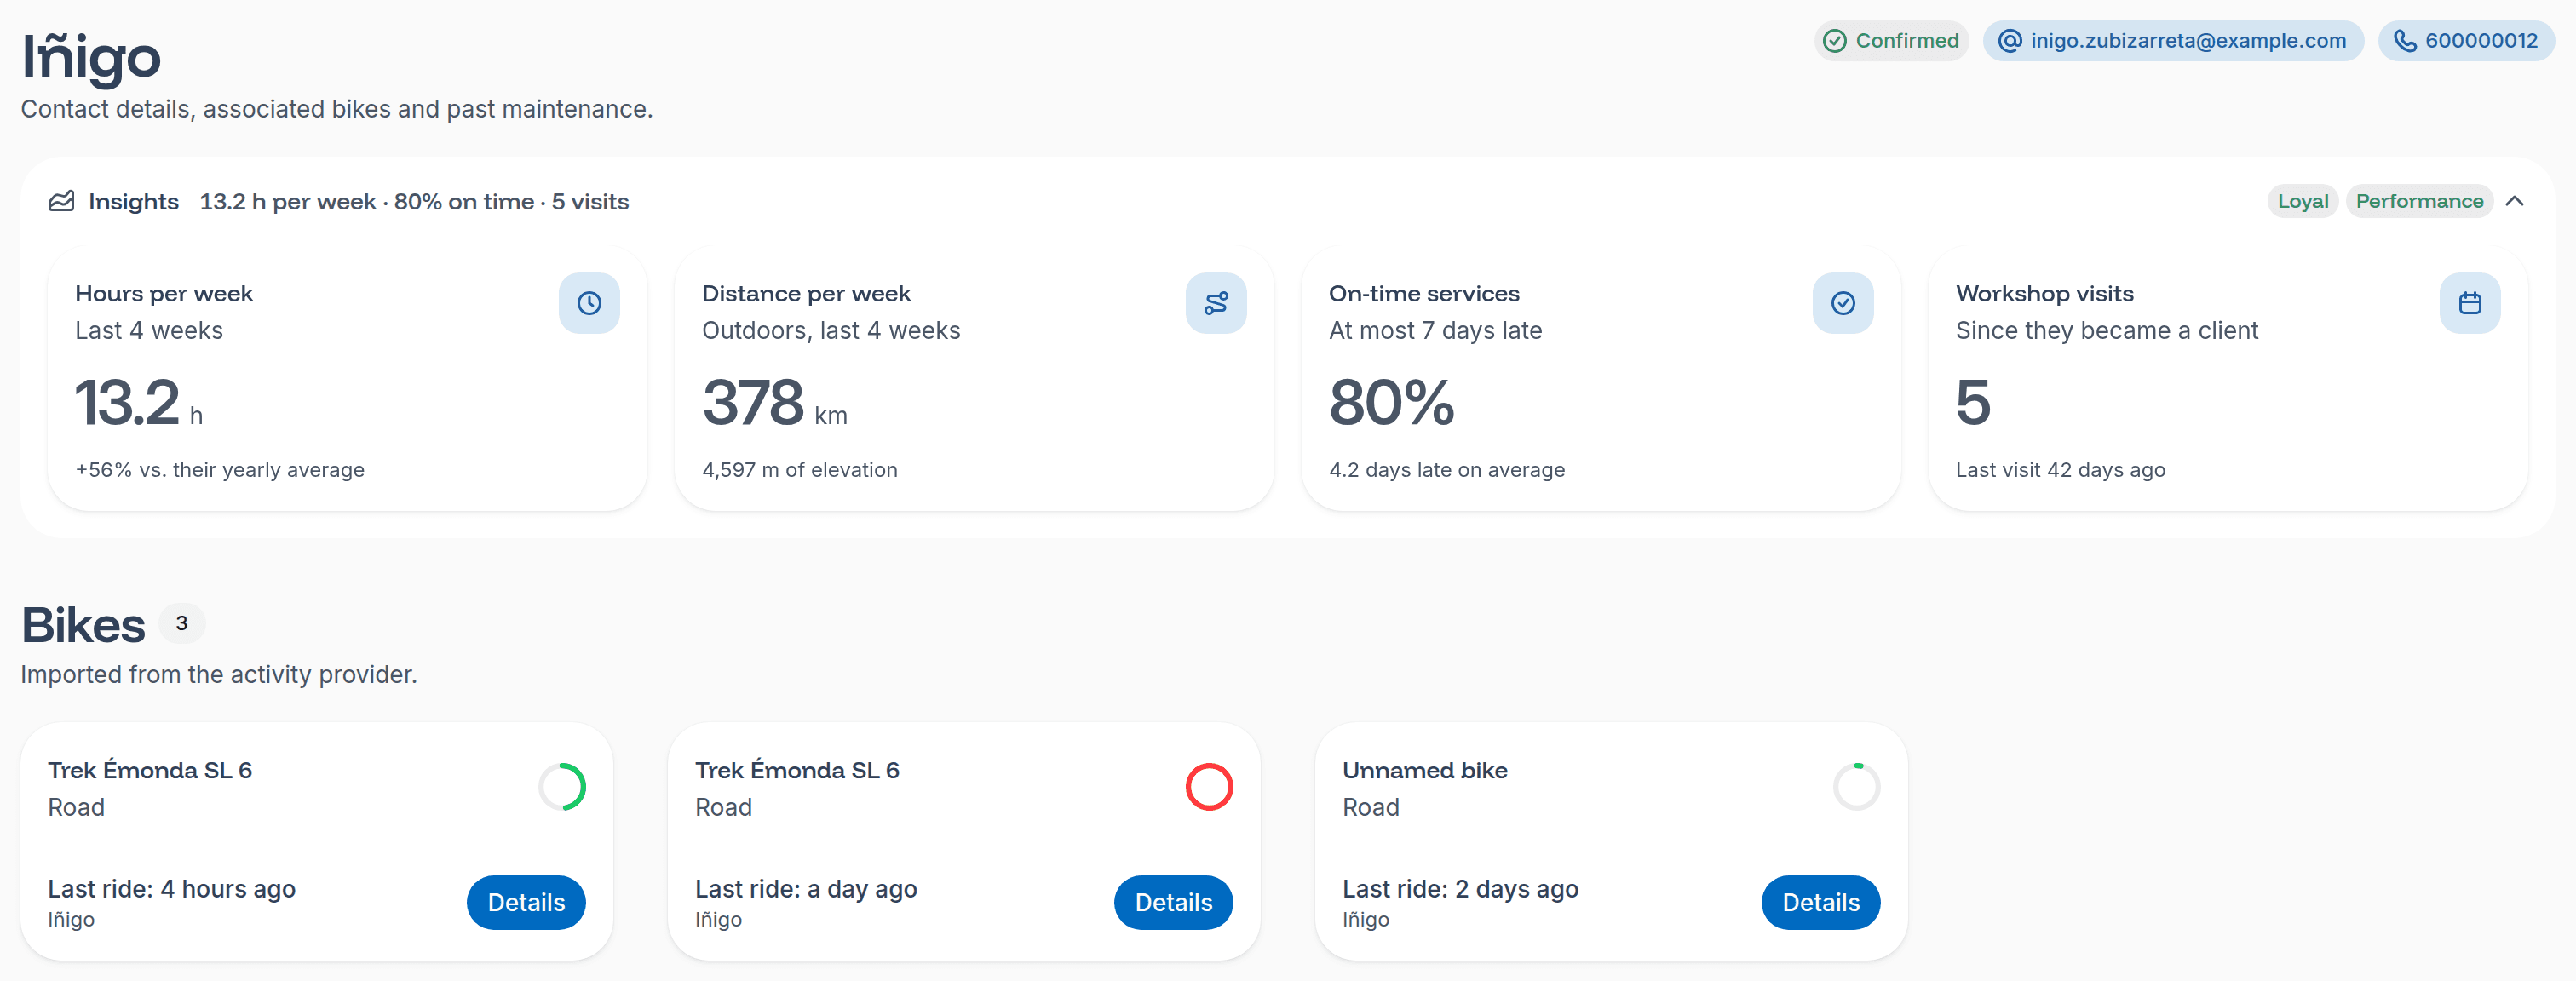
- Rider page: the
Insightscard, with their hours and distance per week over the last 4 weeks, their elevation, theirOn-time serviceswith their average delay, and theirWorkshop visitssince they became a client, with the last one. - Bike page: when there is enough data, how many days are left until its next service based on how it is being ridden
(
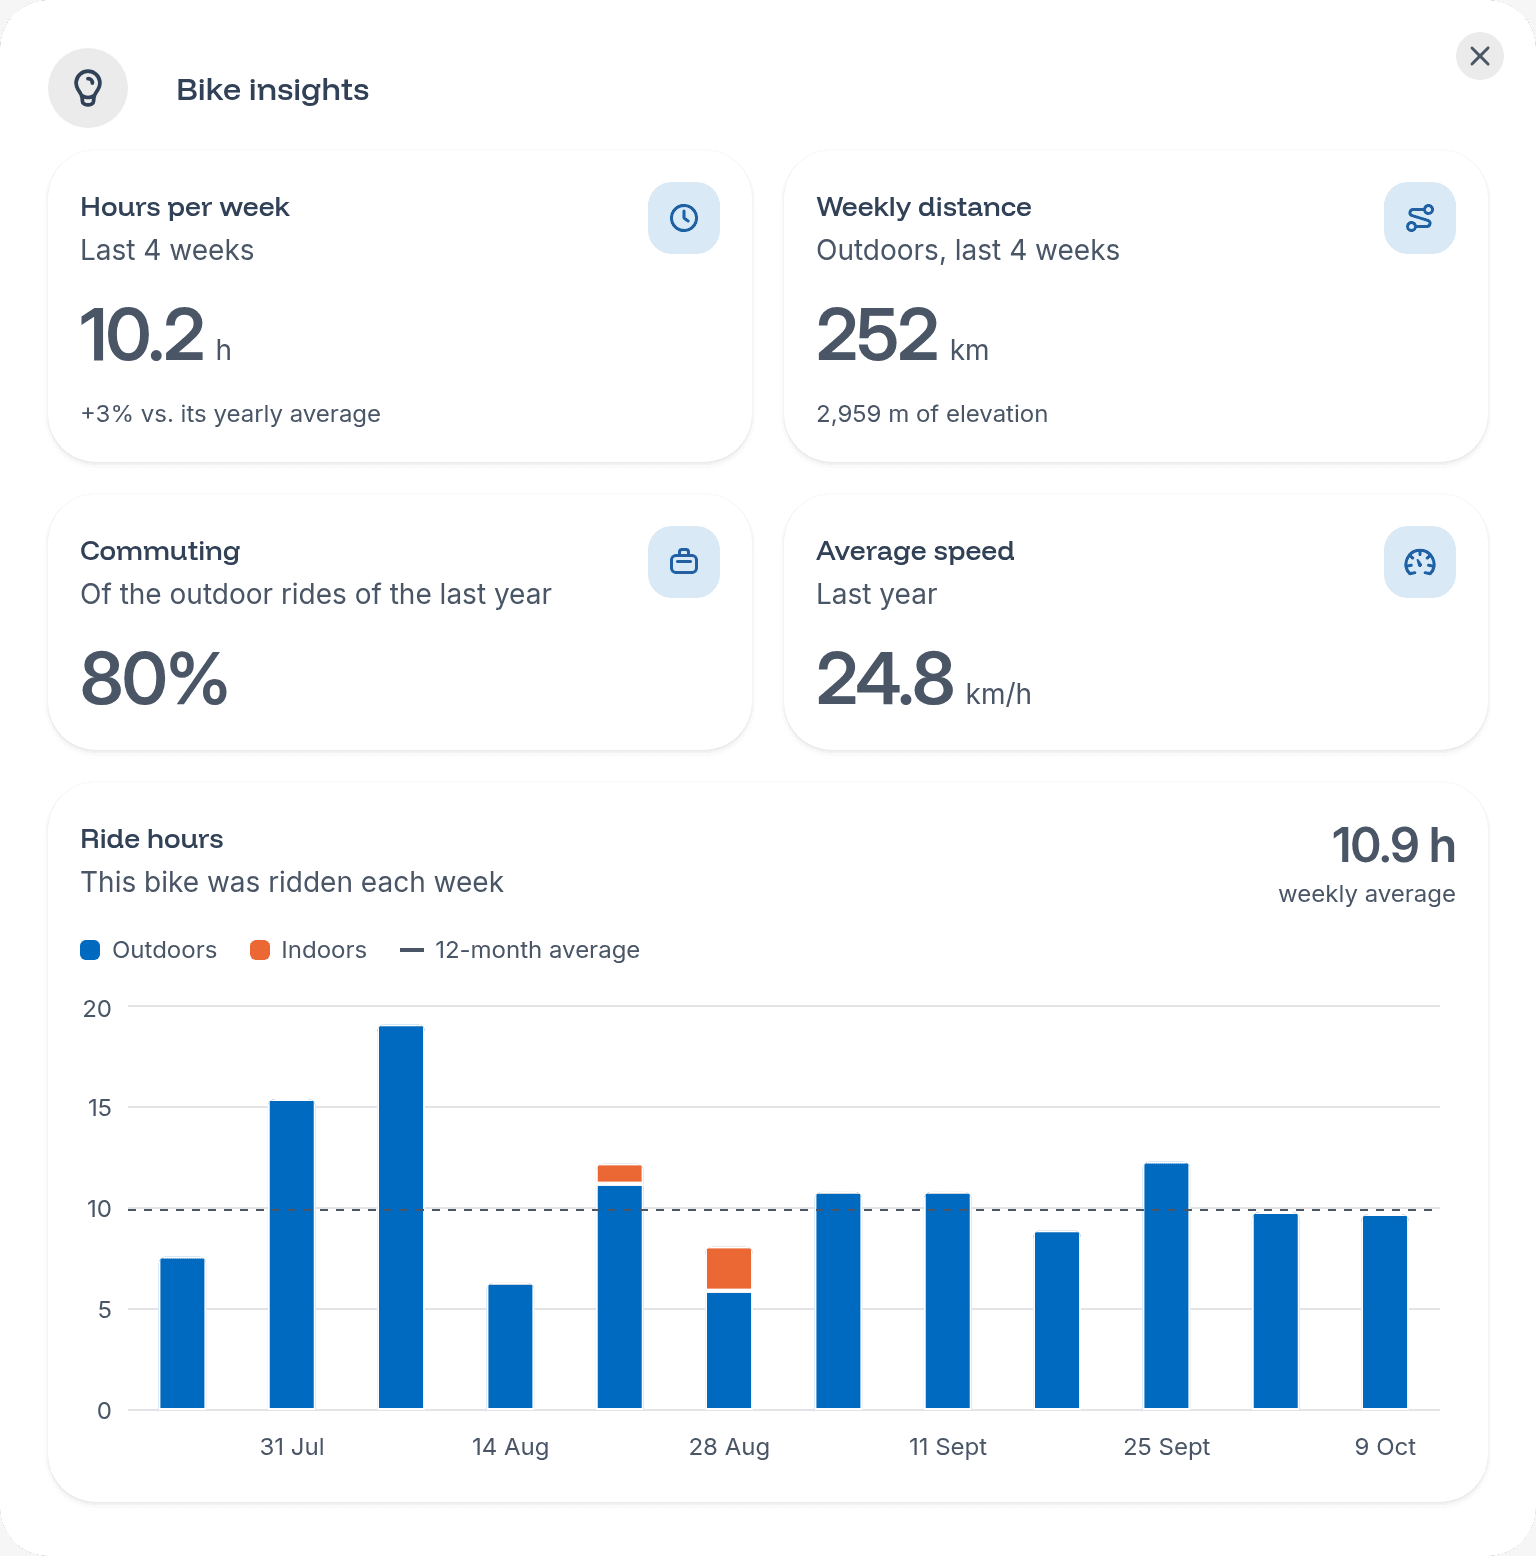
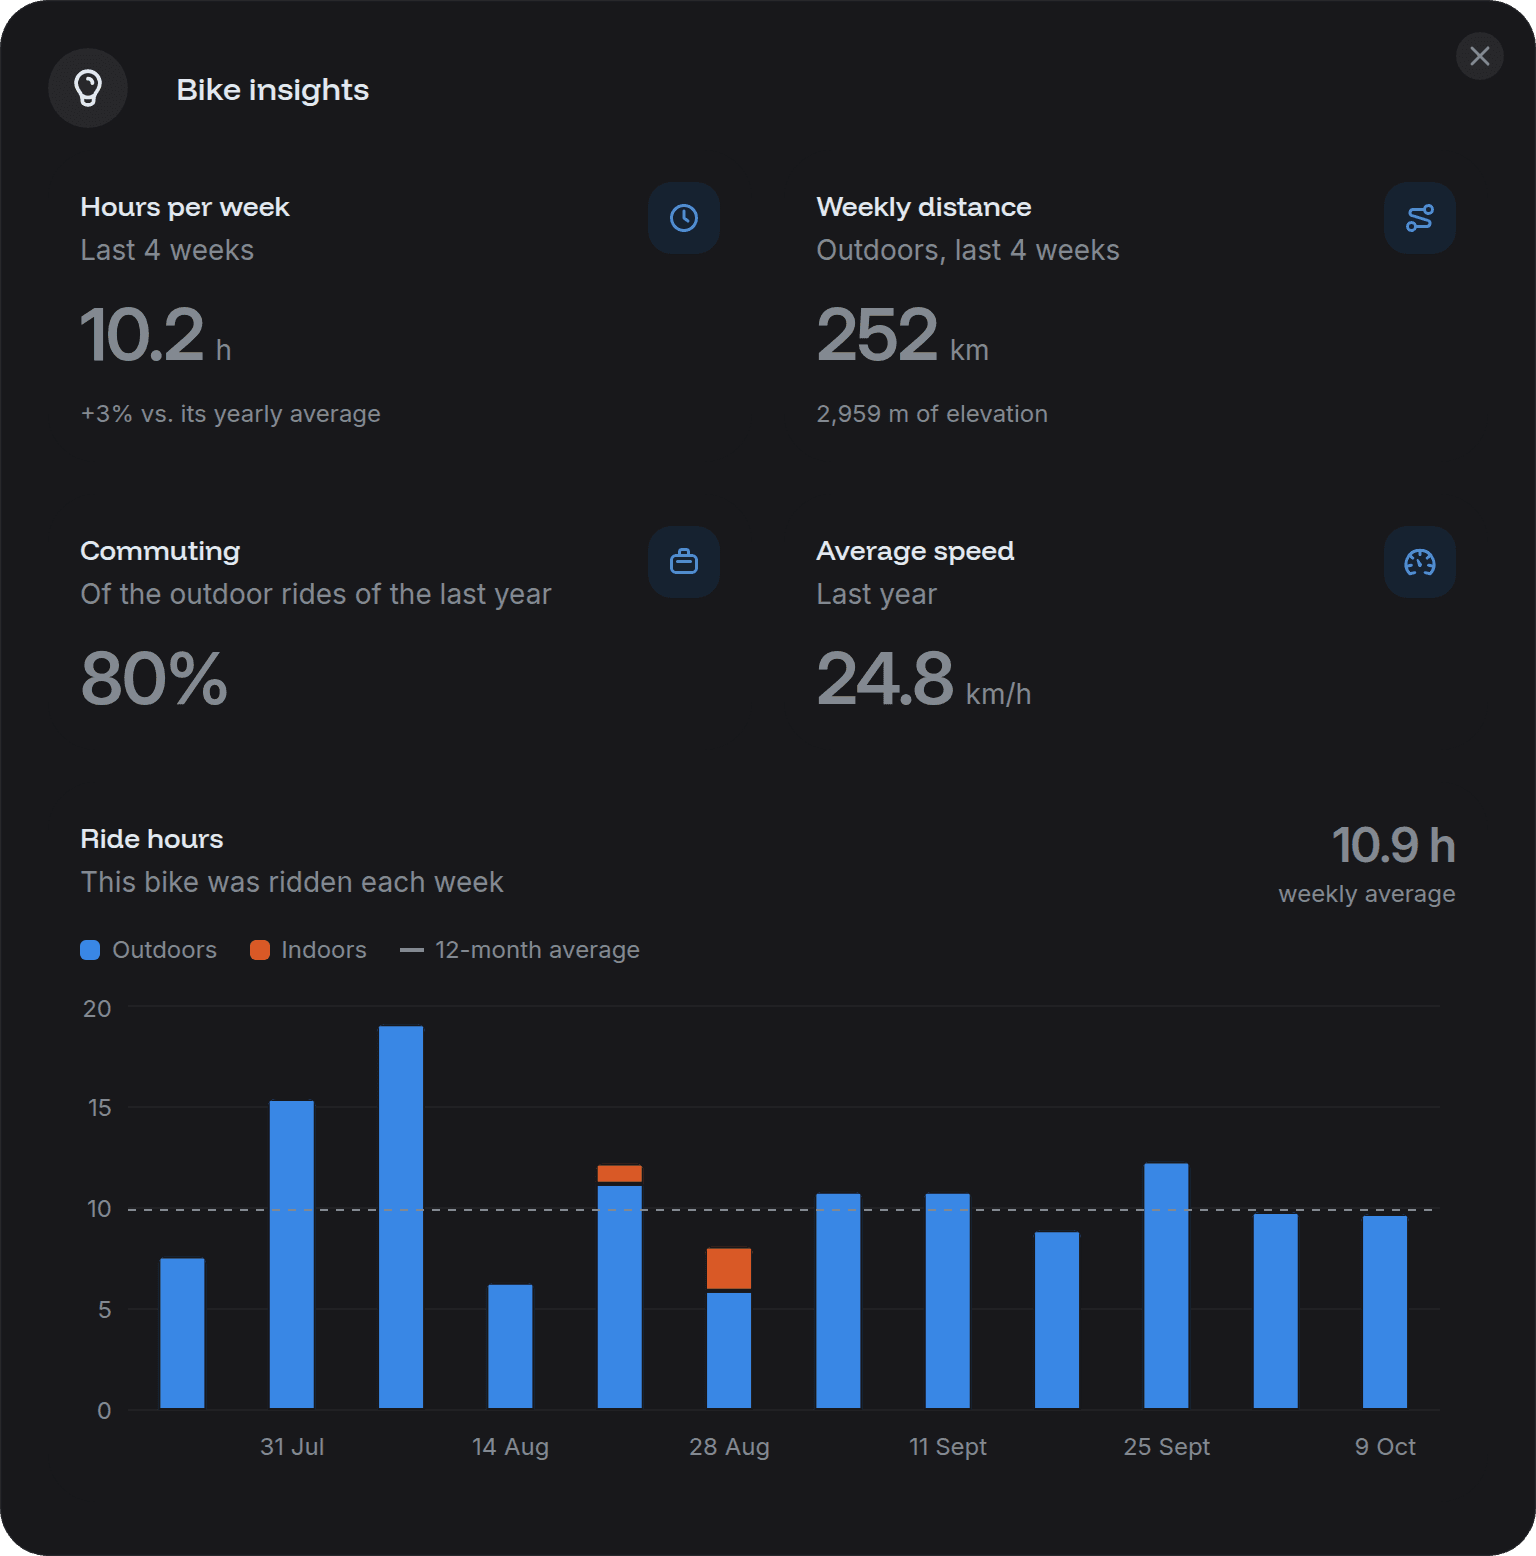
Maintenance in), or how many days ago it was due (Maintenance was due). ItsInsightscard sums up its hours and distance per week, andDetailsopensBike insights, with its average speed over the last year, the share of its outdoor rides that year that were commutes (Commuting), and a chart of how much it was ridden each week.


Indoor rides and commutes
We know whether a ride was indoors or a commute because its sports app says so. See what we import from Strava.