
What your workshop can do with its analytics
Your workshop already knows a lot about its customers: which bike they ride, what you did to it last time, the state it comes in. With sincrona's analytics you also know what happens between visits: how much and how each customer rides, how loyal they are to your workshop and whether their services are done on time.
What you do with all that is up to you. Here are a few ideas.
Recommend what suits each rider
Each rider's page shows how many hours and kilometers they ride a week and how much they climb. Their riding profile sums up how they ride: performance, all-round or commuter. Each bike adds its average speed and how many of its rides are commutes.
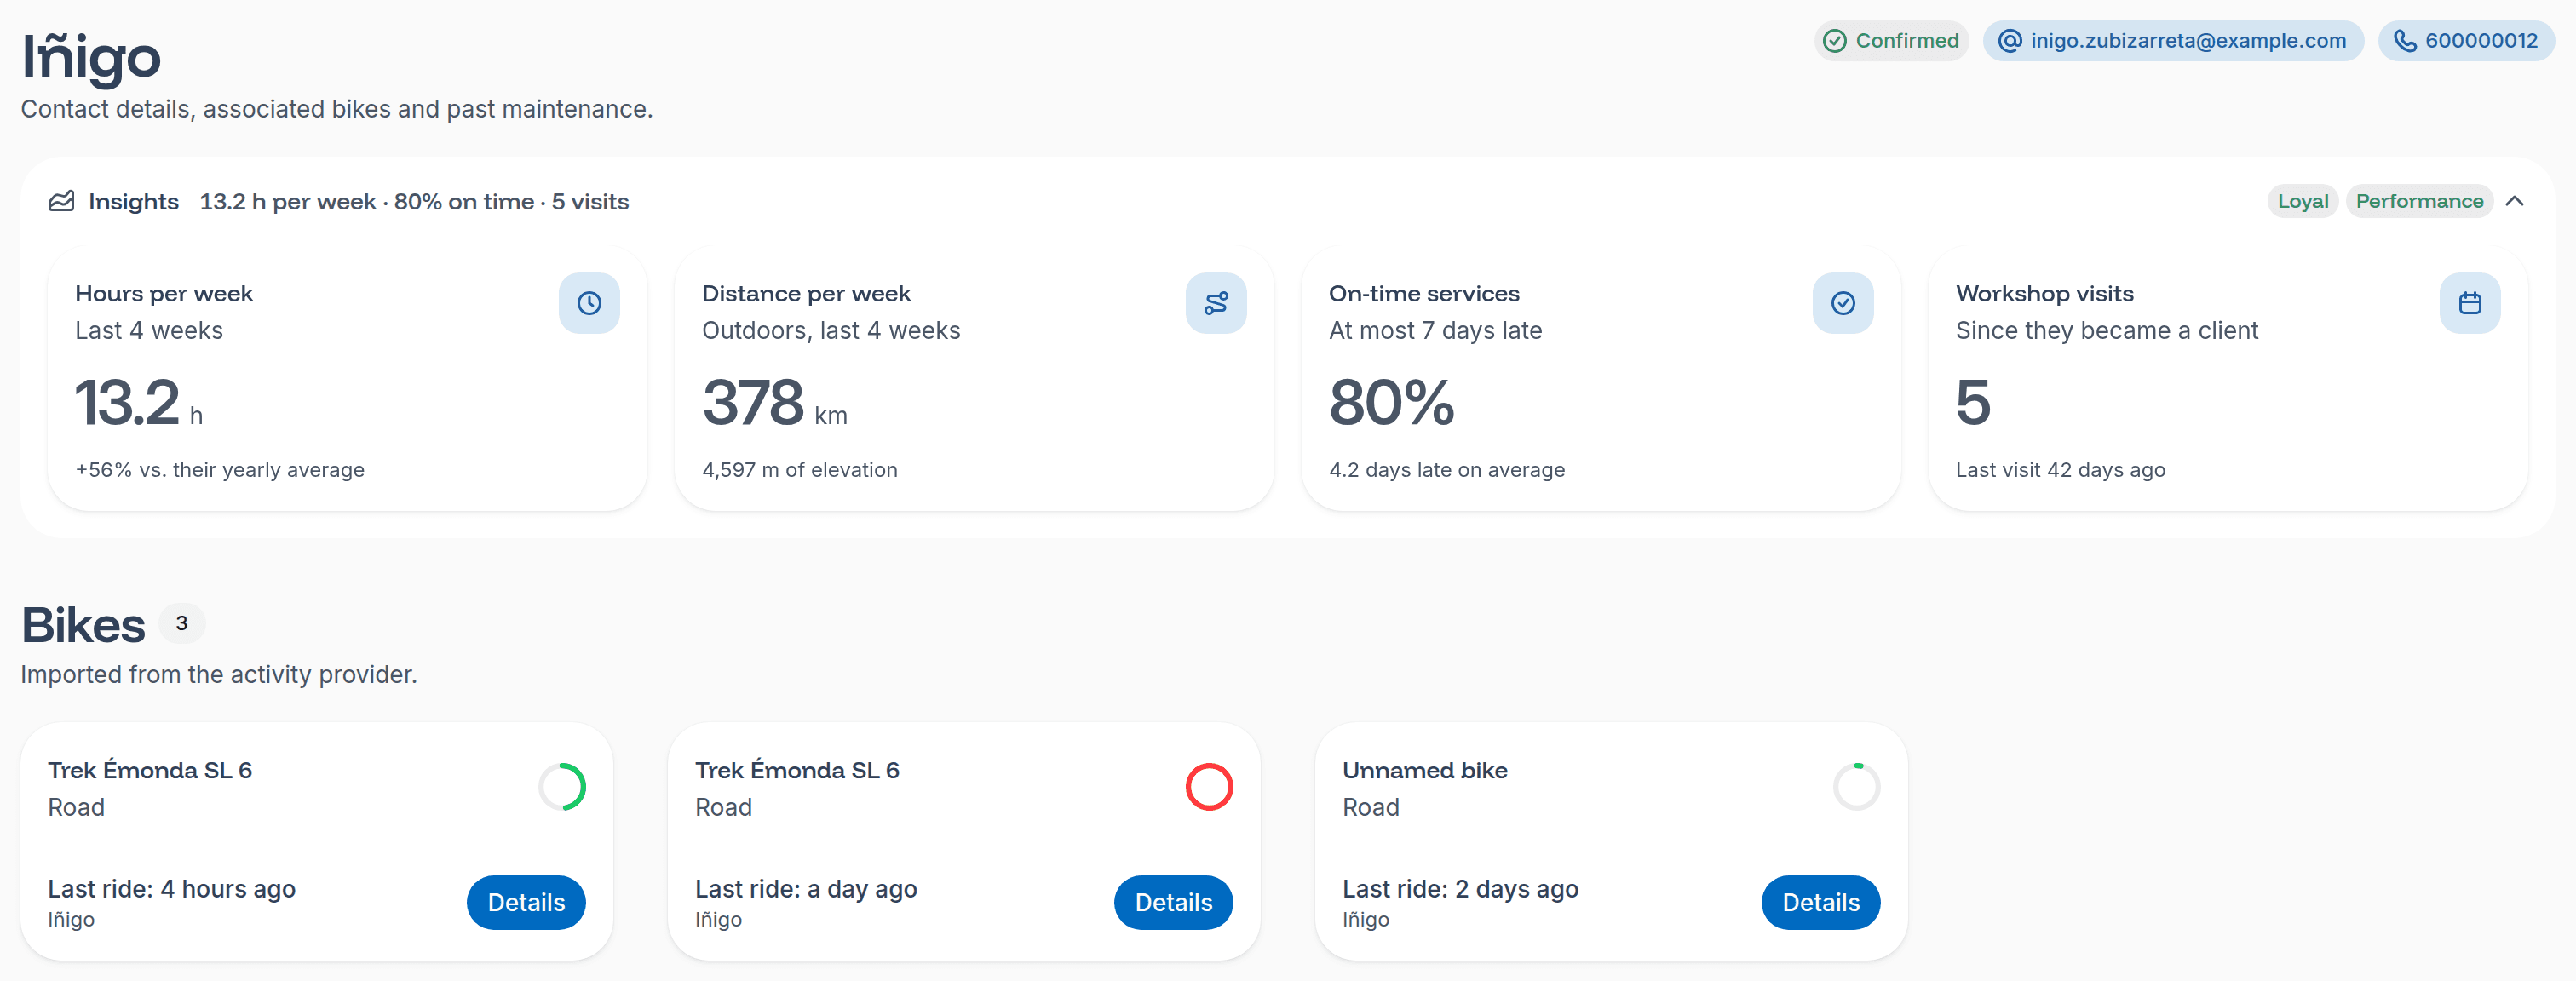
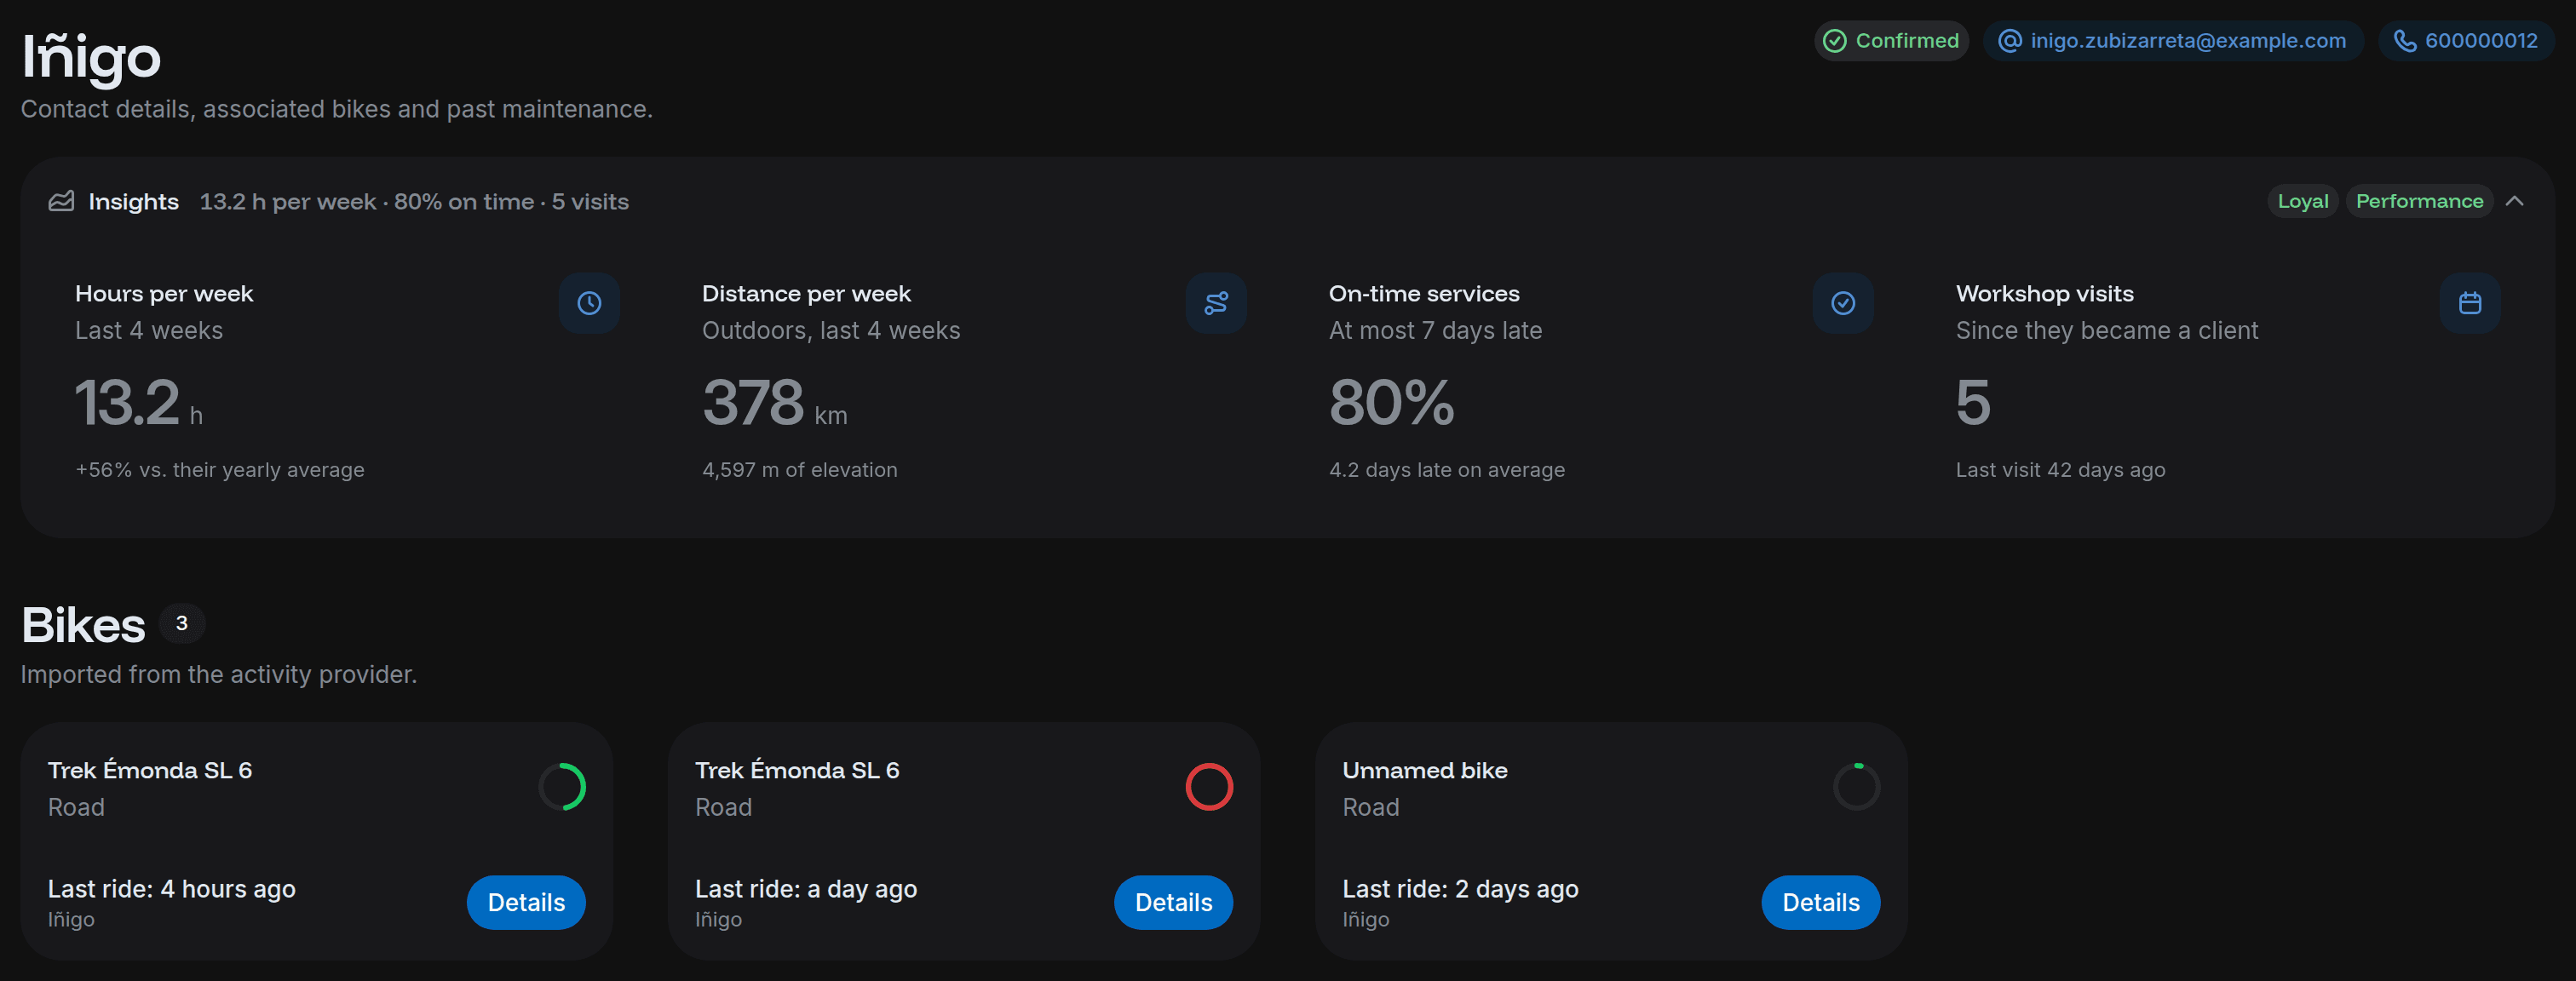
With that, your advice comes from how they ride rather than a guess. Talk drivetrain and brakes with whoever climbs every week, everyday reliability with whoever commutes by bike, a tune-up that covers everything with whoever rides a bit of everything…
Match each customer's experience to their loyalty
Analytics sorts your customers into loyal, regular and at risk, by how long they've been with you and how often they come in. Each group needs something different:
- Loyal: with you for at least 12 months, with at least two visits. Preferential treatment, like priority bookings, a seasonal service at a better price or a small thank-you…, shows them you notice.
- Regular: they come in at their own pace. A timely reminder keeps it that way.
- At risk: they've gone over twice as long as usual without coming in, or over 12 months. A call about something concrete can bring them back.
Spot who's drifting away before you lose them
A customer who stops coming doesn't tell you. The Riders at risk card lists them, the most overdue first, with their last visit. Before you call, check their bike's page for when its next service is due, or how overdue it is: that's a natural reason to talk.
Plan the season
The ride hours chart shows how much your riders rode each week of the period you choose, outdoors and indoors. Together with the services that were due each month and the ones you did, it tells you which months bring your workshop the most work, so you can offer bookings in advance next time.
Start with the customers you already have
The analytics are worked out from the rides we import from your customers' sports apps and the services you record. The more customers you invite, the fuller the picture: you can import your customer list in one go.
Create your workshop's account and start getting to know your customers between visits too.